San Pedro River Wet/Dry Mapping
Protecting nature starts with science.
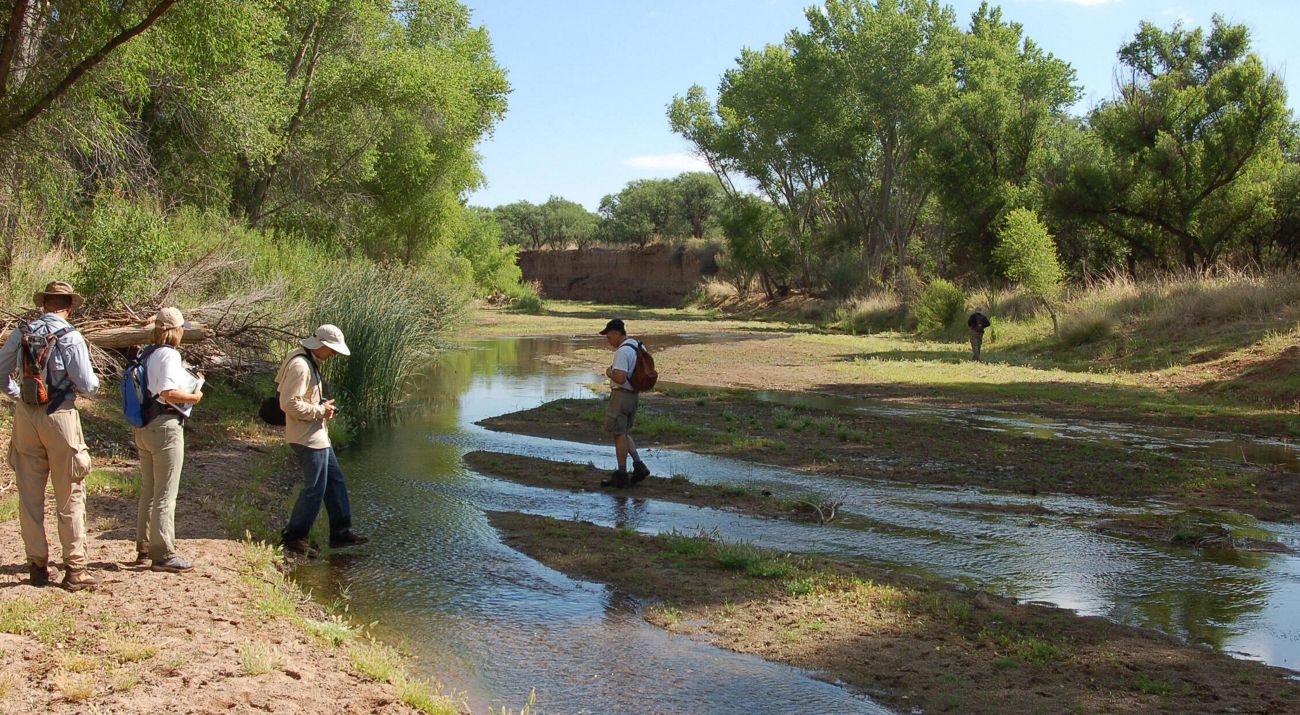
In the arid Southwest, water means life. Yet, we don’t always know where and when surface water is present—or absent. Since 1999, The Nature Conservancy in Arizona (TNC Arizona) has been working with dedicated volunteers and partners to track water presence in streams in the San Pedro watershed during the hottest, driest time of year. The dataset shows us key patterns and long-term trends in surface water and reveals how surface water interacts with groundwater. These annual water presence maps also inform our conservation strategies in the race to protect Arizona’s most precious resource.
The Challenge
Perennial streams in Arizona, which are primarily fed by groundwater, provide flows that sustain our communities, fuel agriculture and support vital riparian habitat and migratory pathways for wildlife. Yet surface diversions, groundwater extractions, prolonged drought—and the increasing impacts of climate change—are threatening these streams and the riparian communities they support. Our analyses estimate that Arizona has lost approximately 35% of its perennial stream flow over the past 200 years. This loss comes with a steep price—one with far-reaching social, economic and ecological consequences. To ensure long-term water sustainability, we need to track and understand when and where water is present and how those patterns trend through time.
What is Wet/Dry Mapping?
Wet/dry mapping is simple. Using hand-held GPS units, and more recently tablets, people record the start- and stop-points of surface water along a stream or river. Using GIS software, these points are translated to lines on a map for display and analysis. View the collection of wet/dry data maps here.
Science-Led Solutions
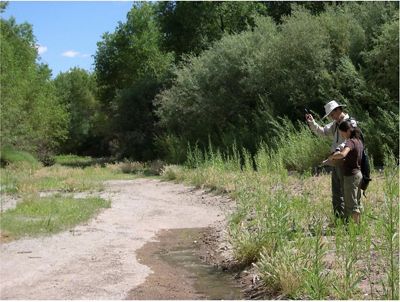
In southern Arizona’s San Pedro River—one of the last major undammed rivers in the Southwest—TNC saw an opportunity. What if we could engage community members to help track the status of this waterway over time? Launching the program in 1999, TNC enlisted scientists, managers and local volunteers to walk the San Pedro River and mark where the river is “wet” and where it is “dry.” Since then, each year on the third Saturday in June, people walk the river and its tributaries to build this “wet/dry” map.
“The timing of the monitoring is important,” notes Jessie Pearl, the freshwater scientist for TNC Arizona. “We have these amazing volunteers going out every year at the driest time of year, right before the monsoon rains typically begin. This ensures we capture an assessment of baseflow and can learn more about the status of the groundwater.” Baseflow is shallow groundwater that is so near the surface, it rises and flows in the channel as surface water.
All this community-driven data collection delivers something powerful: a comprehensive picture of the river’s health. “This mapping is really exciting for scientists,” says Pearl. “We have a decades-long dataset showing the conditions along the river at the same week each year. This allows us to compare year-to-year variability and identify long-term trends.”
New Technology, Easier Mapping & Better Results
Having led the collection of this vital dataset for decades, TNC Arizona is now capitalizing on digital advancements to make wet/dry mapping less time-intensive, safer and more informative. New technology will also help TNC scientists increase the frequency and scale of our wet/dry data collection. For example, we are now:
equipping volunteers with tablets to improve data collection efficiency and make mapping easier for volunteers.
using updated GIS (geographic information system) stream lines in our data processing to improve accuracy and decrease processing time.
partnering with the USDA Agricultural Research Service and the University of Arizona to study the potential of using remotely sensed imagery to detect wetted channel length.
