Wet/Dry Mapping with Tablets
Protecting nature starts with science.
Voices From the Field
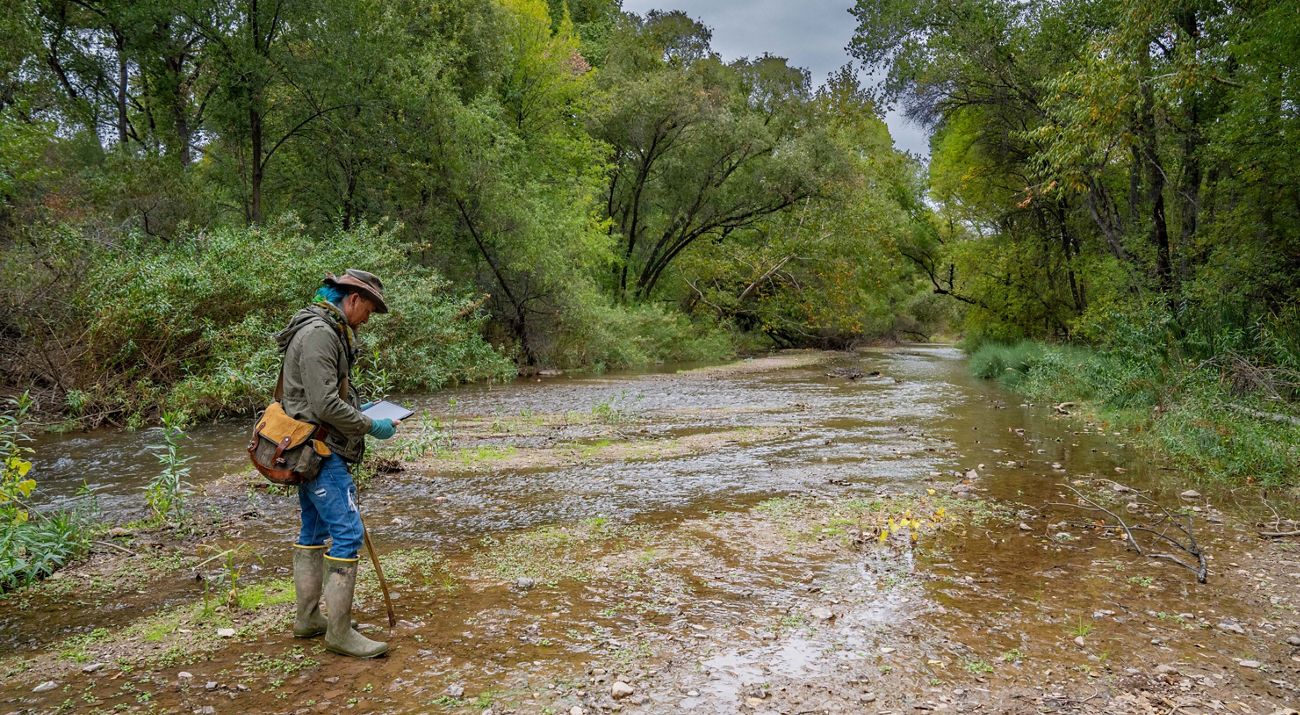
"On the frontlines of conservation, good data is crucial. We're using the latest technology to streamline our wet/dry mapping process for the benefit of our volunteers, our team and our long-term results." -Lisa McCauley, PhD and TNC Arizona's Spatial Scientist
Project Objective
For more than 20 years, The Nature Conservancy in Arizona (TNC Arizona) has led volunteers and partners in wet/dry mapping to track streams in the San Pedro River Basin. This rich data set allows our science team to assess long-term trends in surface water patterns and better understand groundwater/surface water connections.
The challenge? This community-driven data gathering process has always been labor-intensive, and it was also limited in terms of the reliability and scope of its findings.
So, in 2024, our TNC AZ Science team launched a pilot program to improve the way we gather and analyze valuable surface water information for the San Pedro. Our goals are to provide a better volunteer experience, reduce TNC staff time and deliver superior data.
Progress & Opportunity
Our wet/dry mapping in the San Pedro Basin has been a true labor of love—both for volunteers and TNC staff. Since 1999, every year, at the end of the dry summer months, hundreds of people walked the river and tributaries to manually record the presence of surface water.
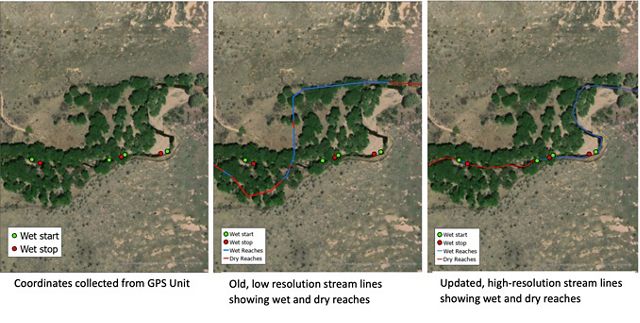
Traditionally, these volunteers used handheld GPS units and paper data sheets to record the start and end points of every wet portion along a stream. After the volunteers finished, the TNC AZ science team gathered all of the GPS units and plugged each one into a computer to extract the data. We also collected the paper data sheets and manually entered their information. Using GIS software, we then combined the data from both sources and translated them into lines on a map to be used for display and analysis.
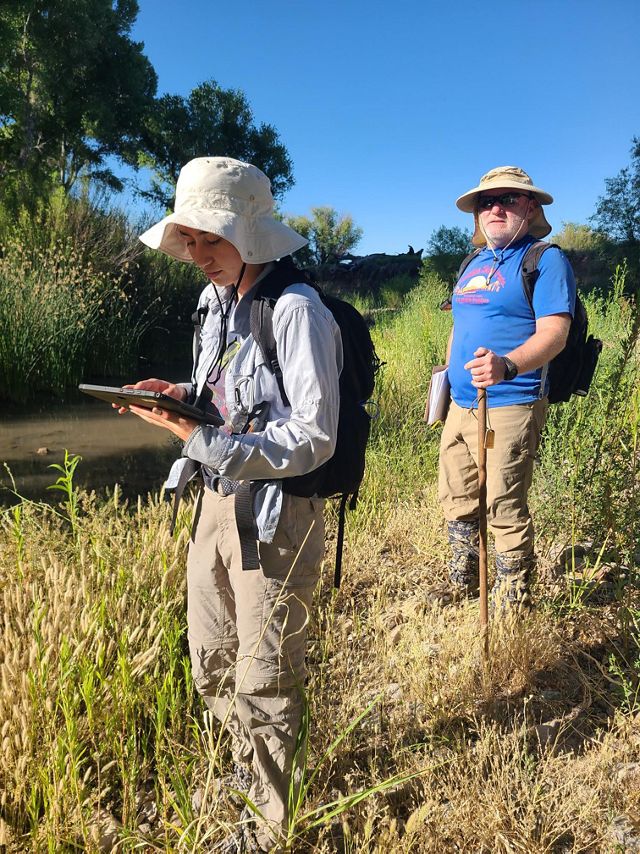
Fast forward to 2024: we’ve made some big improvements. We’ll still rely on our amazing wet/dry map volunteers each year, but now we’ve equipped them with tablets to collect data, and we are using updated GIS (geographic information system) stream lines. The tablets save valuable staff time because the water data is now available in one place, ready for processing immediately after mappers return and sync their data to the cloud. Even more important: the tablets make volunteering easier and safer. Volunteers can now visualize their mapping route in real time, allowing them to easily find parking locations, landowner permission status, photo point locations and any other relevant information.
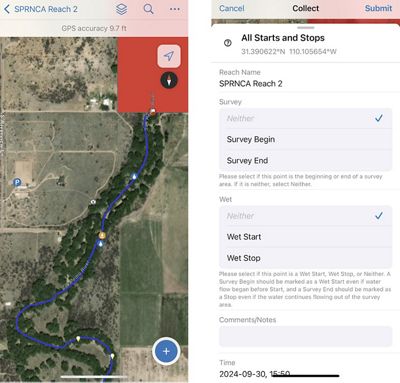
In addition to using tablets to improve data collection, we’re also taking advantage of updated stream line information. Our previous stream and river line data was low resolution and dated, resulting in discrepancies that took time to fix. Today, our team’s new software and high-resolution steam lines give us more accurate results and reduce our data processing time.
