Satellite-based Agriculture Data
National cropland and grassland datasets open new possibilities
In the fertile soils of the regenerative agriculture movement, data is the unseen hero, providing valuable insights to farmers, scientists, agribusinesses and policymakers. Essentially, data is the backbone of decision-making processes that can improve resiliency and efficiency of working lands, while delivering enduring net-positive benefits for people, climate and nature.
The Nature Conservancy (TNC), along with partners at Regrow Ag and the Conservation Tillage Information Center (CTIC), recognizes the value of data to unlock economic and environmental solutions for the agriculture industry. For the last several years, TNC and our partners have been leading the development of the Operational Tillage Information System (OpTIS), remote-sensing data to track trends in cover crops and tillage practices. A $1.78M grant from AgMission to TNC, with matching funds contributed by all three partners, made it possible to expand the work and develop two national remotely-sensed baseline datasets: 1) Data on cover crops, tillage and crop rotation for croplands (OpTIS), and 2) Data on trends in grassland health and productivity. The datasets, which span croplands and rangelands in the contiguous United States, are now available to the public on CTIC’s webpage. A full data refresh with some methodological updates is due in August 2024.
“This project is producing crucial data on where climate-smart practices are being adopted, and how much impact they are having on soils and greenhouse gas (GHG) emissions,” says Allison Thomson, scientific program director for the Foundation for Food & Agriculture Research, which co-created AgMission™ in partnership with the World Farmers’ Organisation. “By making the information publicly available, the many groups and programs working to help farmers adopt climate-smart practices will benefit.”


Agriculture data users from companies, NGOs, scientists and public agencies can use the datasets to report and measure the impact of programs, track return on public and private investments, and advance research to understand barriers to scaling regenerative practices. The national datasets, which can be annually updated, are also a complement to the national USDA Census of Agriculture, taken only once every five years, which provides a snapshot but makes it difficult to track trends overall.
“The national baseline datasets will help us evaluate the extent of regenerative practices on the ground, and with additional updates, can help us track national trends in regenerative ag and the condition of grasslands,” says Shamitha Keerthi, Ph.D., director of science for TNC’s North America Regenerative Crop Systems strategy. “This dataset also offers immense value for social science and research on incentives implementation.”
Cropland Dataset
The remotely-sensed croplands dataset, or OpTIS, tracks the adoption of winter cover crops and identifies tillage practices—both important practices in the regenerative toolkit that can deliver important environmental benefits, including increased carbon sequestration, enhanced soil health and improved water quality and biodiversity. The data is available at the HUC-8 and Crop Reporting District (CRD) levels on CTIC’s webpage.
The cropland data is produced by measuring the level of greenness on the landscape using Normalized Difference Vegetation Index (NDVI) on publicly available data from Landsat and Sentinel satellites. The data is then processed through Regrow’s proprietary algorithm that “stitches” the data temporally through the year, to make inferences on the presence of winter cover and tillage intensity.
The cropland data is also being entered into the computer simulation model DeNitrification-DeComposition Model (DNDC) to determine the environmental benefits associated with the trends of cover crop and conservation tillage use. DNDC measures factors such as nitrous oxide emissions, methane, and soil organic carbon. DNDC-modeled data is also available on the CTIC website.


Quote: Rob Manes
“Grasslands, which store up to 20% of the world’s soil carbon, are among the most destroyed and least protected habitat types on earth, and, unfortunately, what remains is at risk from climate change, land conversion and incompatible management practices,”
Grassland Dataset
“Grasslands, which store up to 20% of the world’s soil carbon, are among the most destroyed and least protected habitat types on earth, and, unfortunately, what remains is at risk from climate change, land conversion and incompatible management practices,” says Rob Manes, co-director of TNC’s North America Regenerative Grazing Lands strategy. “Tools like the new national grasslands dataset provide essential information to ranchers, decision-makers, researchers and others who are working to manage these lands in ways that benefit people, the climate and the many species of wildlife that depend on them.”
The grasslands dataset was developed using satellite-derived plant functional types and net primary productivity (NPP) metrics. Plant functional types refer to a classification system of plant species based on their similar functions and role in the ecosystem. NPP is how much carbon dioxide plants take in during photosynthesis minus how much they release during respiration. The grasslands dataset measures the current status of grasslands, identifies trends in the time period evaluated, and provides maps of productive, stable and degrading grasslands.
Additionally, deviations in herbaceous NPP from what is expected from climate factors only, is also available. While not a direct indicator of management, these data—which are available at the HUC 8 and CRD levels—may represent the response of grasslands to management factors.
Data Insights
All of the following insights are derived from the last national satellite-driven datasets assessing croplands and grasslands between 2015 and 2021.
Cover Crops
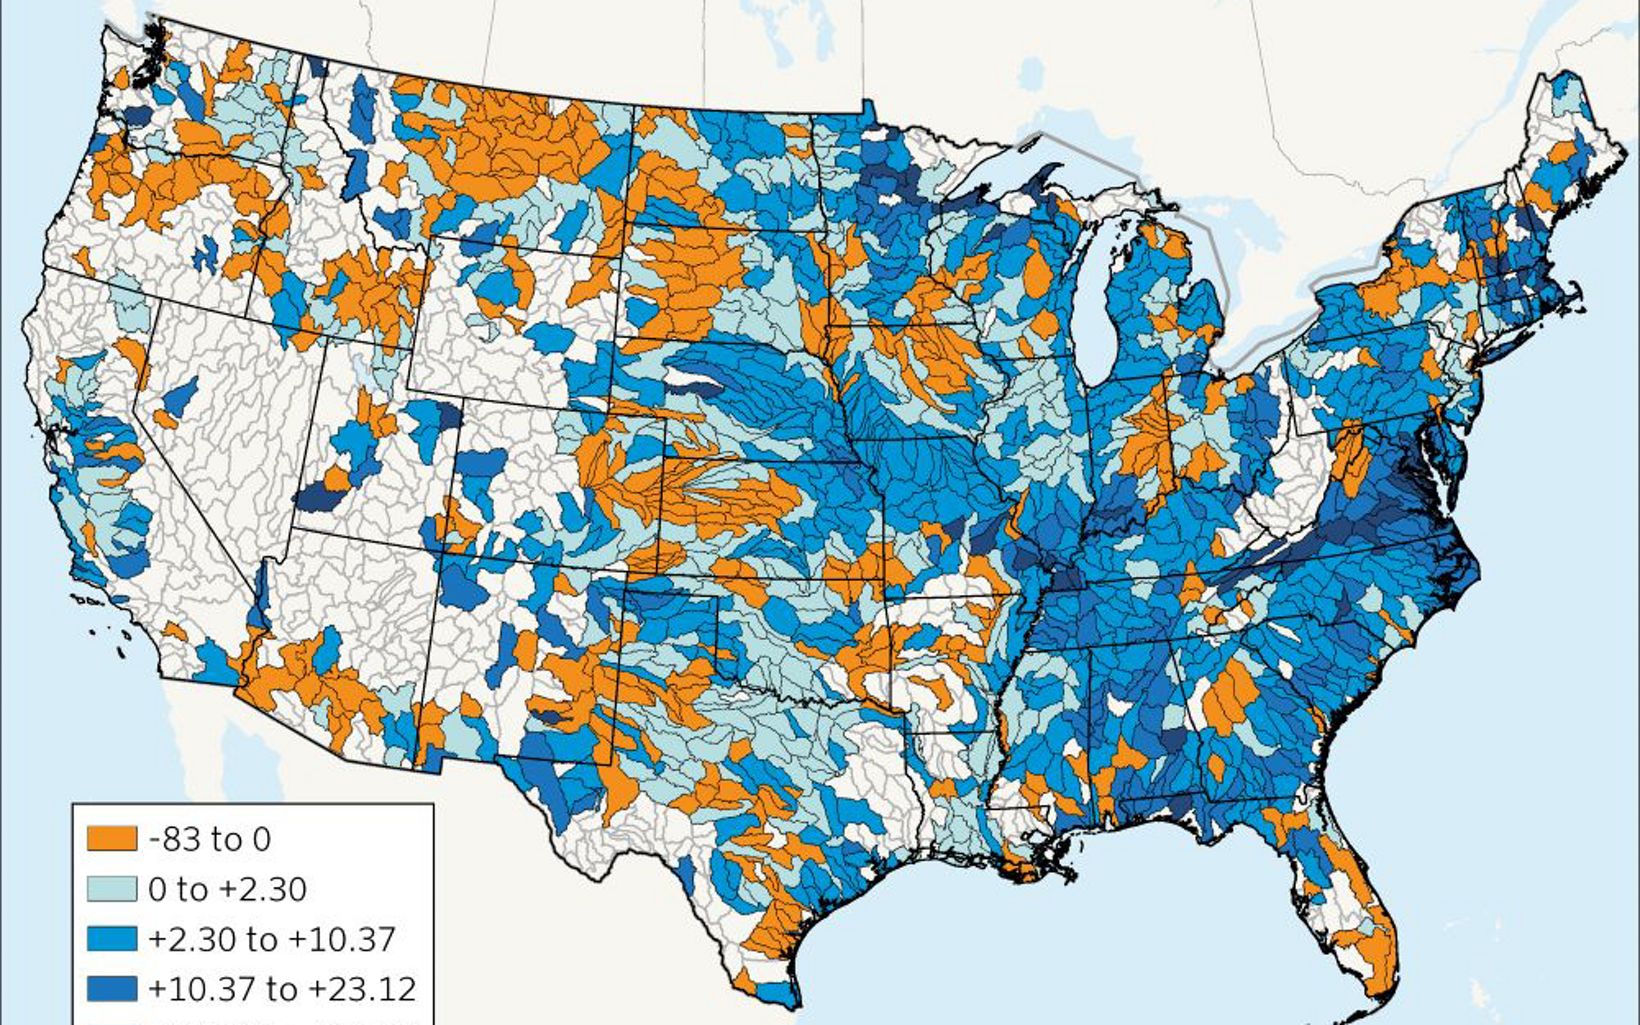
- Available data (updated July 2023) shows that between 2015 and 2021 cover crop adoption increased by 2.4% percentage points (from 3.5% of total row crop acres with winter cover in 2015 to 5.9% of total row crop acres in 2021).
- Most U.S. regions experienced an increase in adoption between 2015 and 2021, except in the Mountain time zone states where adoption dropped by -0.2%. This loss was driven by a decrease in cover crop acres in Arizona, Montana and New Mexico.
Conservation Tillage
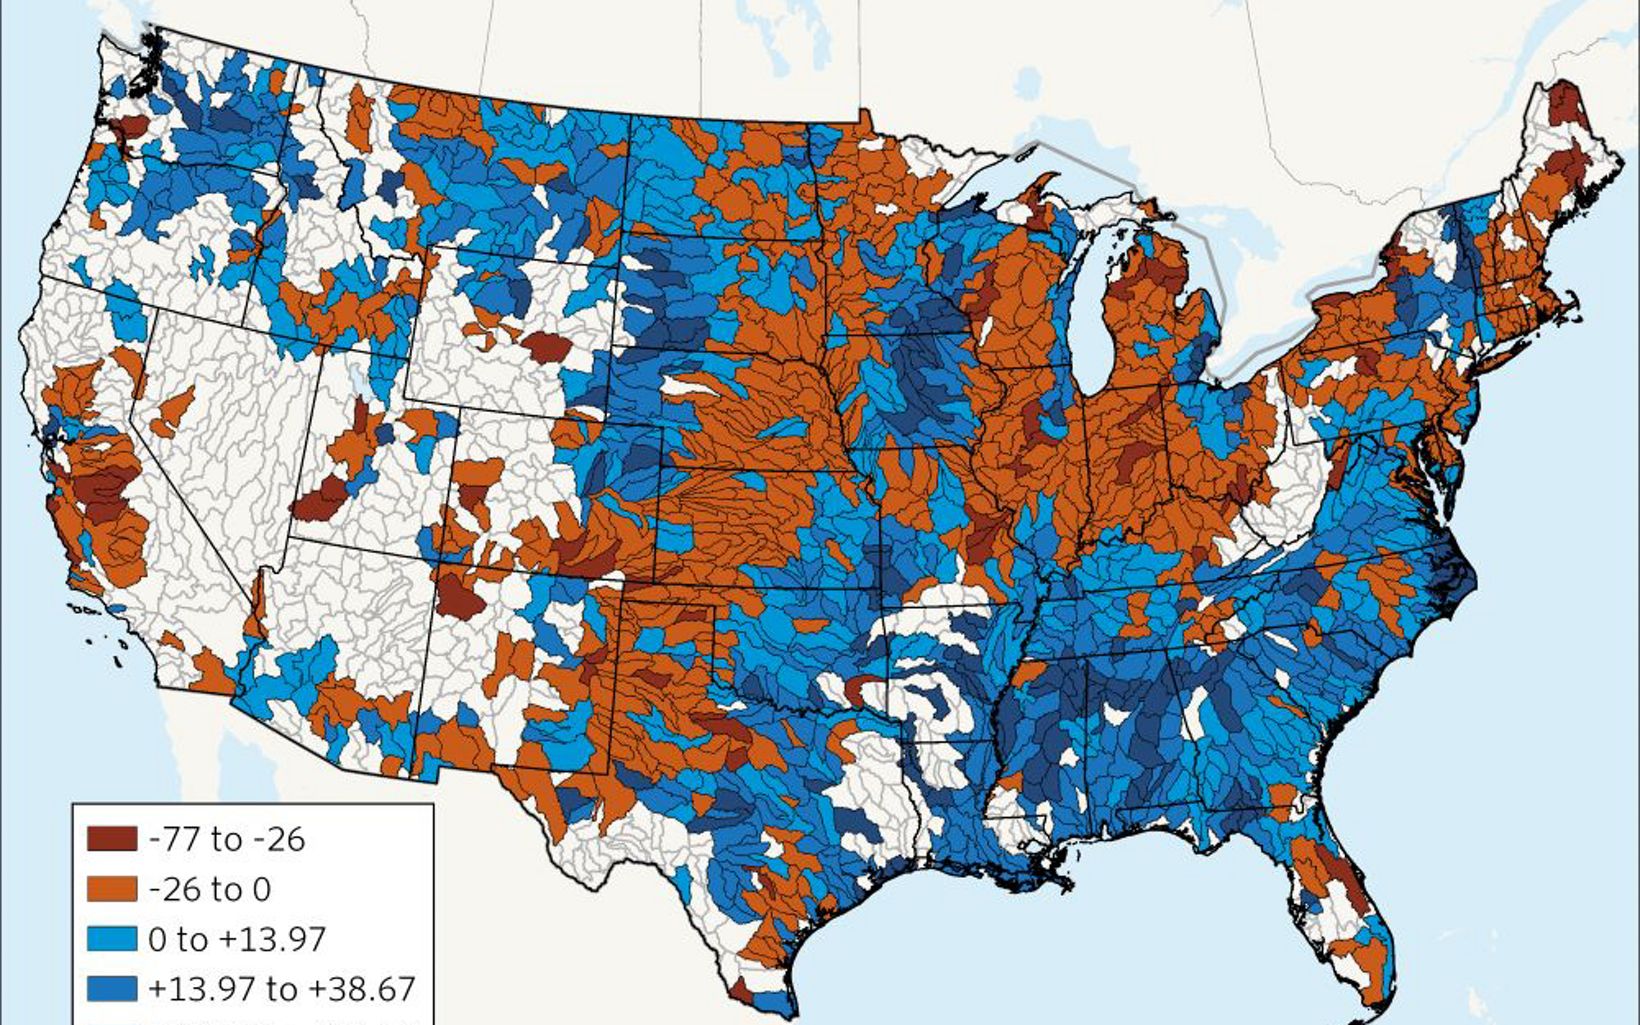
- Conservation tillage acres went up by 10 percentage points (from 33.9% to 43.8% of total acres) between 2015 – 2021.
- No-till acres decreased by about 6.2 percentage points (from 31.8 % to 25.6% of total acres in 2015 and 2021 respectively).
Grasslands
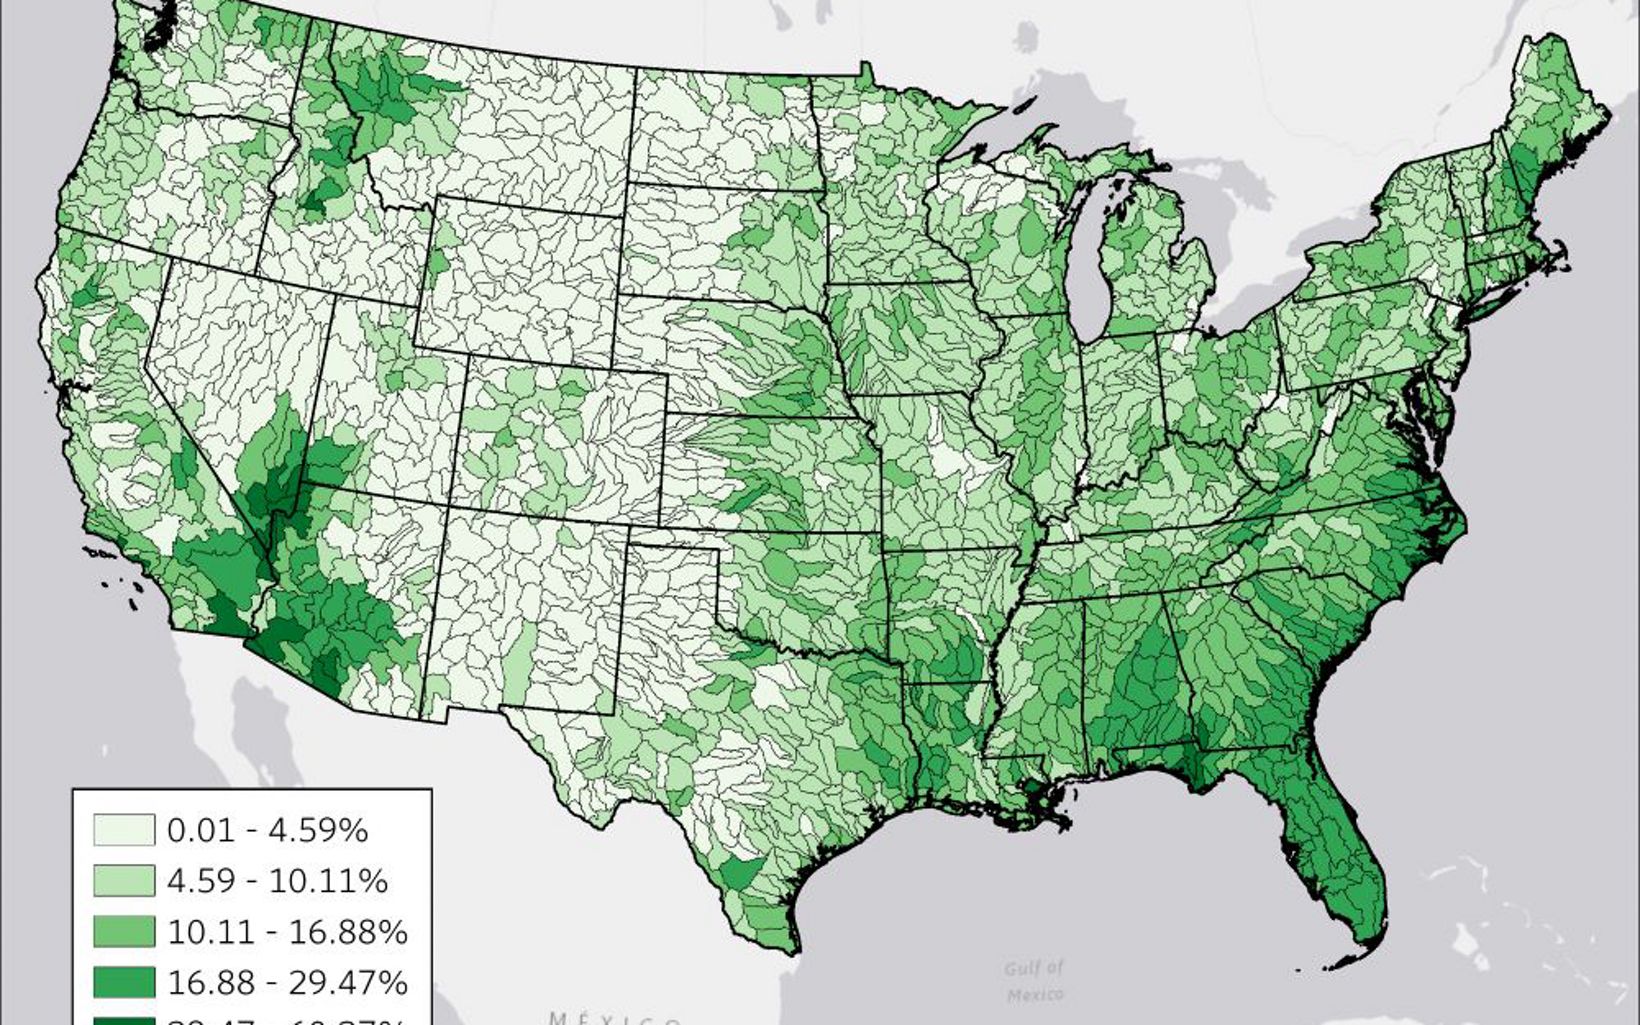
- Within the United States’ 2,119 HUC-8 watersheds, 7.5% of all grassland acres show a positive trend (healthy/improving grassland systems), 18.5% of all grassland acres show a negative trend (deteriorating systems) and the rest of the acres appear stable between 2015 – 2021.
- The vast majority of trends observed across the country (88.2% of all acres) can be explained by climate-related factors, while about 5.2% of acres are in a worse condition than explained by climate alone. These data can help stakeholders identify the HUC-8s that need additional investment of resources or incentives for better grassland management.
Dig into Soil Stories
Remote Sensing Data Advances Soil Health Science
New OpTIS tool reveals that soil health practices can help farmers cope with extreme weather events.
Rethinking Soil, Reinvesting in Our Foundations
See how innovations in farming can protect our lands and waters and store carbon.
Soil Management – A Foundational Strategy for Conservation
Soil is more than just a geological backdrop—healthy soil is the basis of all life and provides water, food, clean air, a stable climate and good health.